matplot tutorial
- 1 minmatplot tutorial(객체화 방식)
2d
import matplotlib.pyplot as plt
- 기본적인, 하나의 figure에 하나의 그래프
- fig = plt.figure()
- figure내 그래프창 추가 1) axes1 = fig.add_axes([.1,.1,.8,.8]) #[x축위치,y축위치,가로길이,세로길이] ->그래프창(비균등) 2) or axes1 = fig.add_subplot(111) #111 -> 가로분할1 세로분할1 첫번째그래프1(균등)
- axes1.plot(x,y)
- plt.show()
- figure한창 and 같은 그래프창 여러 그래프
같은방식!, 다만 plot(그리기)을 여러번 호출- axes1.plot(x,y,’색상’)
- axes1.plot(x1,y1,’색상’)
- figure한창 and 독립적인 여러그래프
객체에 여러 axes(비균등) 혹은 sub_plot(균등)을 추가하면 된다- axes1 = fig.add_axes([.,.,.,.])
- or axes1 = fig.add_subplot(222) #가로분할2 세로분할2 의 2번째그래프 의미
- 이렇게 독립 그래프창 추가해주고 바로 밑에 라인에서 plot해서 해당 그래프 작성하는 방식
3d
import matplotlib.pyplot as plt from mpl_toolkits.mplot3d import Axes3D # 3d plotting을 위해서 이게 필요
위방식과 같은 방식, 다만 그래프창 추가할때
- ax = fig.add_subplot(111, projection = ‘3d’) #2번째 arg가 들어간다
- ax.plot(x,y,z,’색상’)
## 부수적 내용
-
legend : 이선이 무슨선인지
ax.plot(x,y,z,색상,label = ‘’)
ax.legend(loc = 10) #legend위치 arg로 넘긴다 -
plot 모양정하기!
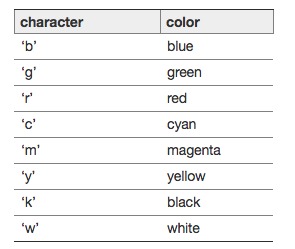
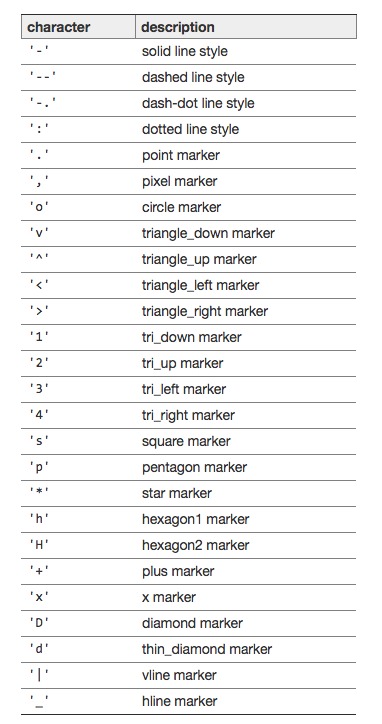
ax.plot(x,y,z,color = ‘‘,linewidth = 5(선굵기), alpha = 5(투명도), linestyle = ‘-‘ ,maker = ‘‘(점모양새), makersize = 20, makerfacecolor = ‘’, markedgewidth = 3(마커외각모양) ,markeredgecolor = ‘’)
파라미터 뭐 들어갈지는 인터넷에서 찾아서 상황에 따라 선택하기
- plot 말고 다른 형태
- plt.scatter : 흩뿌리는 점형태
- plt.hist : 히스토그램